Visibility is key in an organization’s efforts to effectively monitor, manage, and secure its IoT networks. Businesses today face a visibility challenge. Although they own the devices and data, the out-of-perimeter cellular networks, such as cellular or Fiber based, do not belong to them. This creates a paradox: to achieve the necessary visibility, organizations are forced to deploy hardware and software in the field.
This approach is not only costly but also high-risk, especially in cases where devices are scattered across numerous locations, such as EV charging stations, Point-of-Sale, or Smart Grids. For mobility-related use cases, where there are no fixed locations to capture and analyze traffic, this method becomes impractical. Consequently, most organizations today only have limited visibility into device communications that reach their premise. But why is this a problem?
The Visibility Challenge
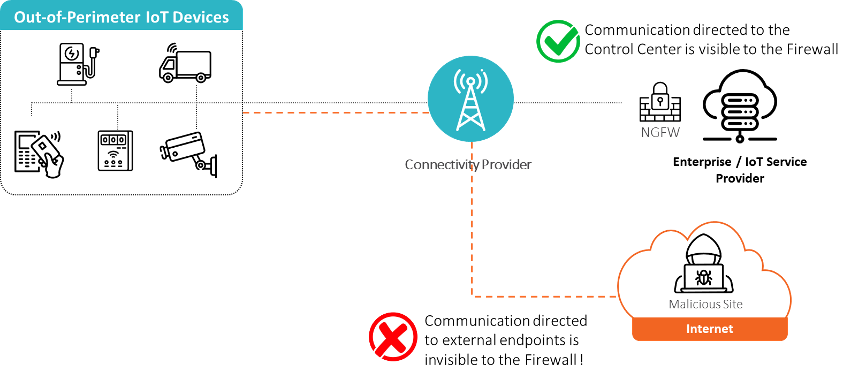
You Cannot Protect What You Cannot See
The diagram below illustrates the visibility risk organizations face today. While an organization can monitor inbound communications, if a device is compromised and, for example, communicates with an unauthorized destination or malicious site, the organization remains completely unaware. This blind spot can result in severe consequences, including personal data breaches, data theft, poisoning of edge AI models, service disruption, and downtime.
Step 1 | Identify
Cybersecurity Best Practices
Enabling operational and cyber users to gain visibility and continuous monitoring of their IoT/OT network and devices.
Asset IDs
Risk Score
Location
Attributes
Data Usage
Network Insights
Visualization Maps
Operational Trends
Communication Statistics
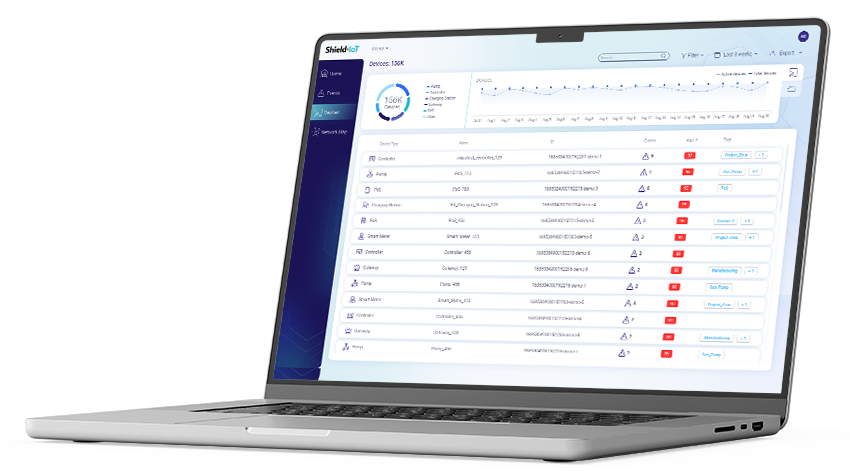
Network Assets Visibility
See all your devices
Zoom-in on high risk devices
See all your network assets and zoom in on any specific device or group of devices that may be of interest. Simple ‘slice & dice’ capability enables the user to filter/sort network assets based on any relevant parameters such as asset risk score, type, last security or operational event date, user-defined tags, and more, thereby providing users with a real sense of control over their IoT and OT networks.
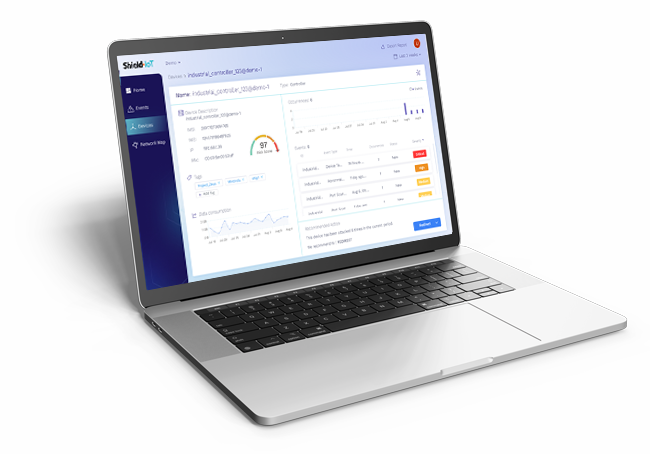
In-Depth Asset Visibility
Device operational visibility
Device risk score & attack timeline
Gain detailed visibility into device operations and risk levels, including device identity, type, attributes, usage trends, risk scores, detected operational anomalies, and events timeline. This comprehensive view allows you to see the ‘big picture’ of each asset, ensuring normal operation from both security and usage/cost perspectives.
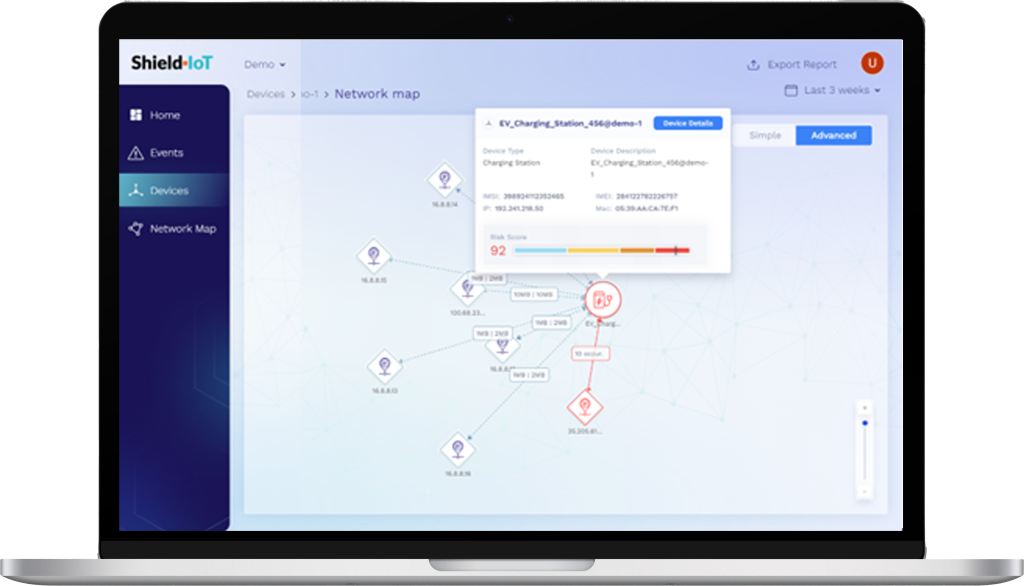
Network Maps
Device network behavior
Visualization maps
The module also offers users instant insight into a device’s network behavior with visualization maps that display all endpoints the device communicates with, including the organization’s control center, unauthorized destinations, and even suspected malicious sites.
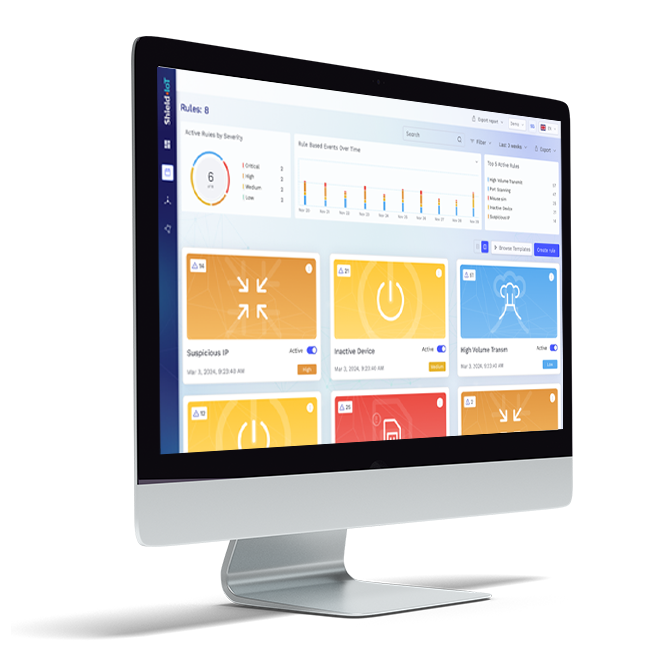
Optimized Network Operations with User-based Rules
Optimize your IoT/OT network performance and service with user-defined configurable rules tailored to your specific application’s needs. Whether you want alerts when a device becomes inactive, experiences an unexpected burst in traffic, or misuses resources (e.g. accessing YouTube, Netflix etc.) which can lead to high connectivity costs and performance issues – these rules allow you to manage it all.
With user-based rules, operational and security users can quickly and easily define any type of communication rule for devices through an intuitive UI, without the need for coding, scripting, or technical expertise.
The module features a simple 1-2-3 rule creation and update wizard for advanced users, along with a unique built-in “What-if” visual analysis capability. This tool allows users to instantly validate and optimize their rules. For example, they can see how many hits the rule would have generated over the past week and optimize as needed.
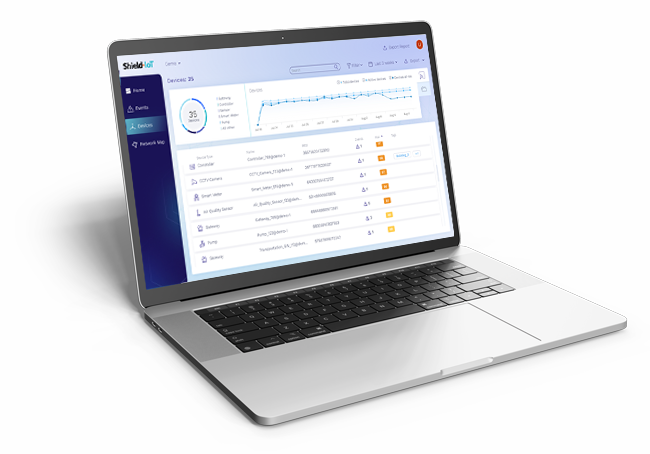
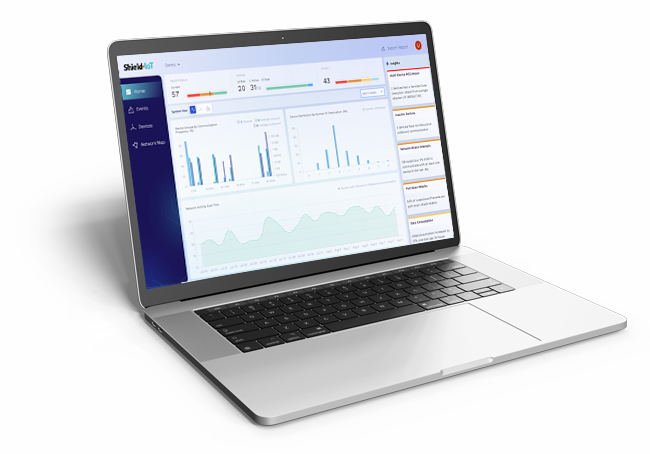
Network-Wide Operational View
Network trends
Visualization tools
The module provides operational visibility not only at a device level but across the entire network.
Pre-defined graphs and visualization tools allow users to track various network-wide trends, such as inbound/outbound communication volume, distribution of external endpoints, and active/inactive devices over time. This enhanced visibility helps users better understand network operations, which can lead to optimized service performance and reduced costs.
Product Demo
Sign-up now
Let us show you how Shield-IoT can expand your IoT security and operational monitoring capabilities.
Complete the form to contact us
By supplying my contact information, I authorize Shield-IoT to contact me with personalized communications about Shield-IoT products and services.